Bubble Diagrams vs Flow Charts: Understanding the Key Differences
Understanding Diagramming Tools: Bubble Diagrams vs Flow Charts
As architects and designers navigate the conceptual stages of a project, visualization tools become essential for articulating ideas, exploring relationships, and communicating intent. Among these tools, bubble diagrams and flow charts stand out as distinct yet complementary methods, each serving specific purposes in the design process.
While they may appear similar at first glance, these diagramming techniques employ different visual languages and serve fundamentally different functions. Understanding when and how to use each can significantly enhance your design process and communication efficiency.
Bubble Diagrams: Spatial Relationships and Adjacencies
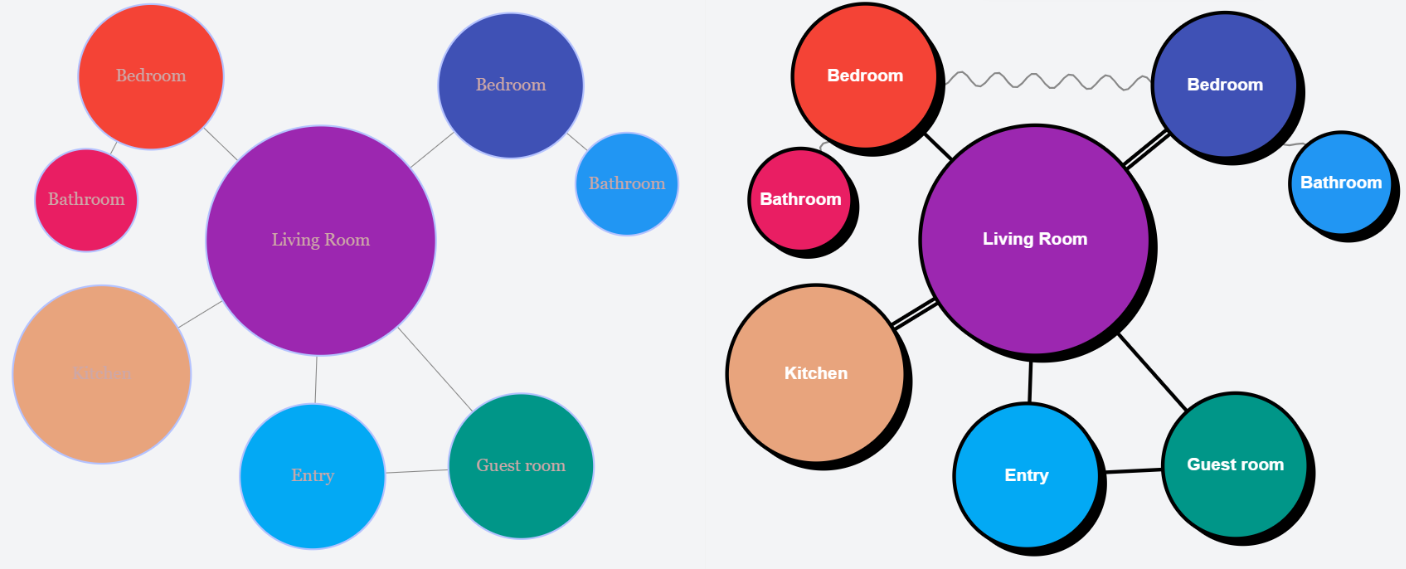
Bubble diagrams primarily focus on spatial relationships and functional adjacencies. They represent:
- Physical spaces or programmatic elements as "bubbles"
- Relative sizes indicating proportional area requirements
- Connections showing desired proximity or relationships
- Non-linear arrangements that explore multiple potential configurations
- Abstract representations free from specific geometries or exact dimensions
Key Characteristics of Bubble Diagrams
- Non-sequential: Unlike flow charts, bubble diagrams don't typically represent a specific sequence or directional process
- Spatially oriented: Focused on how spaces relate to one another in terms of proximity and connection
- Flexible geometry: Bubbles can be arranged in multiple configurations to explore different spatial organizations
- Proportional representation: The size of bubbles often indicates relative space requirements
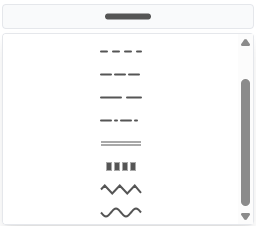
- Connection strength: Lines between bubbles may vary in thickness to indicate importance of relationships
When to Use Bubble Diagrams
- Early conceptual design phases when exploring spatial arrangements
- Programming exercises to establish functional relationships
- Client discussions about space priorities and adjacencies
- Site planning to establish broad zoning concepts
- Reorganization of existing spaces to improve functional relationships
Flow Charts: Sequential Processes and Decision Paths
Flow charts, by contrast, illustrate sequential processes, decision points, and logical progression. They represent:
- Step-by-step procedures or workflows
- Clear directional movement (typically top-to-bottom or left-to-right)
- Decision points with branching outcomes
- Linear or branching progressions toward specific endpoints
- Standardized symbols indicating different types of actions or decisions
Key Characteristics of Flow Charts
- Sequential: Flow charts represent processes that follow specific orders of operations
- Directional: Arrows clearly indicate the direction of movement through the process
- Decision-based: Diamond shapes typically represent decision points with yes/no or multiple-choice outcomes
- Standardized symbols: Different shapes represent different types of actions (e.g., rectangles for processes, diamonds for decisions)
- Linear organization: Even with branches, flow charts generally progress toward defined endpoints
When to Use Flow Charts
- Documenting design or construction processes
- Illustrating approval sequences or permitting procedures
- Explaining user journeys through a space
- Defining operational protocols for facilities
- Mapping out decision trees for various design scenarios
Practical Application in Architectural Design
In architectural practice, these tools often serve complementary roles at different project stages:
Early Conceptual Phase
- Bubble diagrams help establish spatial relationships and explore program organization
- Flow charts might document the design approval process or client decision sequence
Schematic Design
- Refined bubble diagrams evolve into more definite spatial arrangements
- Flow charts could illustrate user circulation patterns through the proposed spaces
Design Development
- Bubble diagrams transform into actual floor plans with specific geometries
- Flow charts might document systems integration sequences or construction phasing
Construction Documentation
- Flow charts help clarify complex assembly sequences or system operations
- Bubble diagrams are typically no longer used at this stage
Digital Tools and Enhanced Capabilities
Modern digital platforms like Archi Bubble enhance these traditional diagramming approaches:
Digital bubble diagramming tools offer:
- Dynamic relationship modeling
- Real-time area calculations
- Multiple connection types and strengths
- Color-coding for different functions or zones
- Easy iteration and refinement
Similarly, digital flow chart tools provide:
- Standardized symbol libraries
- Automatic alignment and connection
- Collaborative editing features
- Interactive elements for presentations
- Integration with project management systems
Making the Right Choice for Your Needs
When deciding between bubble diagrams and flow charts, consider these questions:
-
Are you representing spatial relationships or sequential processes?
- Spatial relationships → Bubble diagram
- Sequential processes → Flow chart
-
Is directional movement or process flow critical to what you're communicating?
- Yes → Flow chart
- No → Bubble diagram
-
Are you exploring multiple possible arrangements or documenting a defined procedure?
- Exploring arrangements → Bubble diagram
- Documenting procedures → Flow chart
-
Are you in the early conceptual phase of spatial design?
- Yes → Bubble diagram
- No (later in process) → Possibly flow chart
Conclusion: Complementary Tools for Different Needs
Rather than competing alternatives, bubble diagrams and flow charts should be understood as complementary tools serving different visualization needs. While bubble diagrams excel at representing spatial relationships and functional adjacencies, flow charts provide clarity for sequential processes and decision paths.
By understanding the strengths and appropriate applications of each, designers can select the right diagramming approach for their specific communication goals, enhancing both the design process and client understanding.
Ready to create your own professional bubble diagrams? Try Archi Bubble → Looking for more diagramming insights? Check out our guide on creating effective bubble diagrams.
Archi Bubble provides specialized tools for creating bubble diagrams that help architects and designers visualize spatial relationships and optimize functional adjacencies during the conceptual design phase.